The Economy tab is a clean economic calendar. Every scheduled macro release lands here with High / Medium / Low impact flags, the affected country, and the three numbers that matter: Forecast, Actual, Previous.
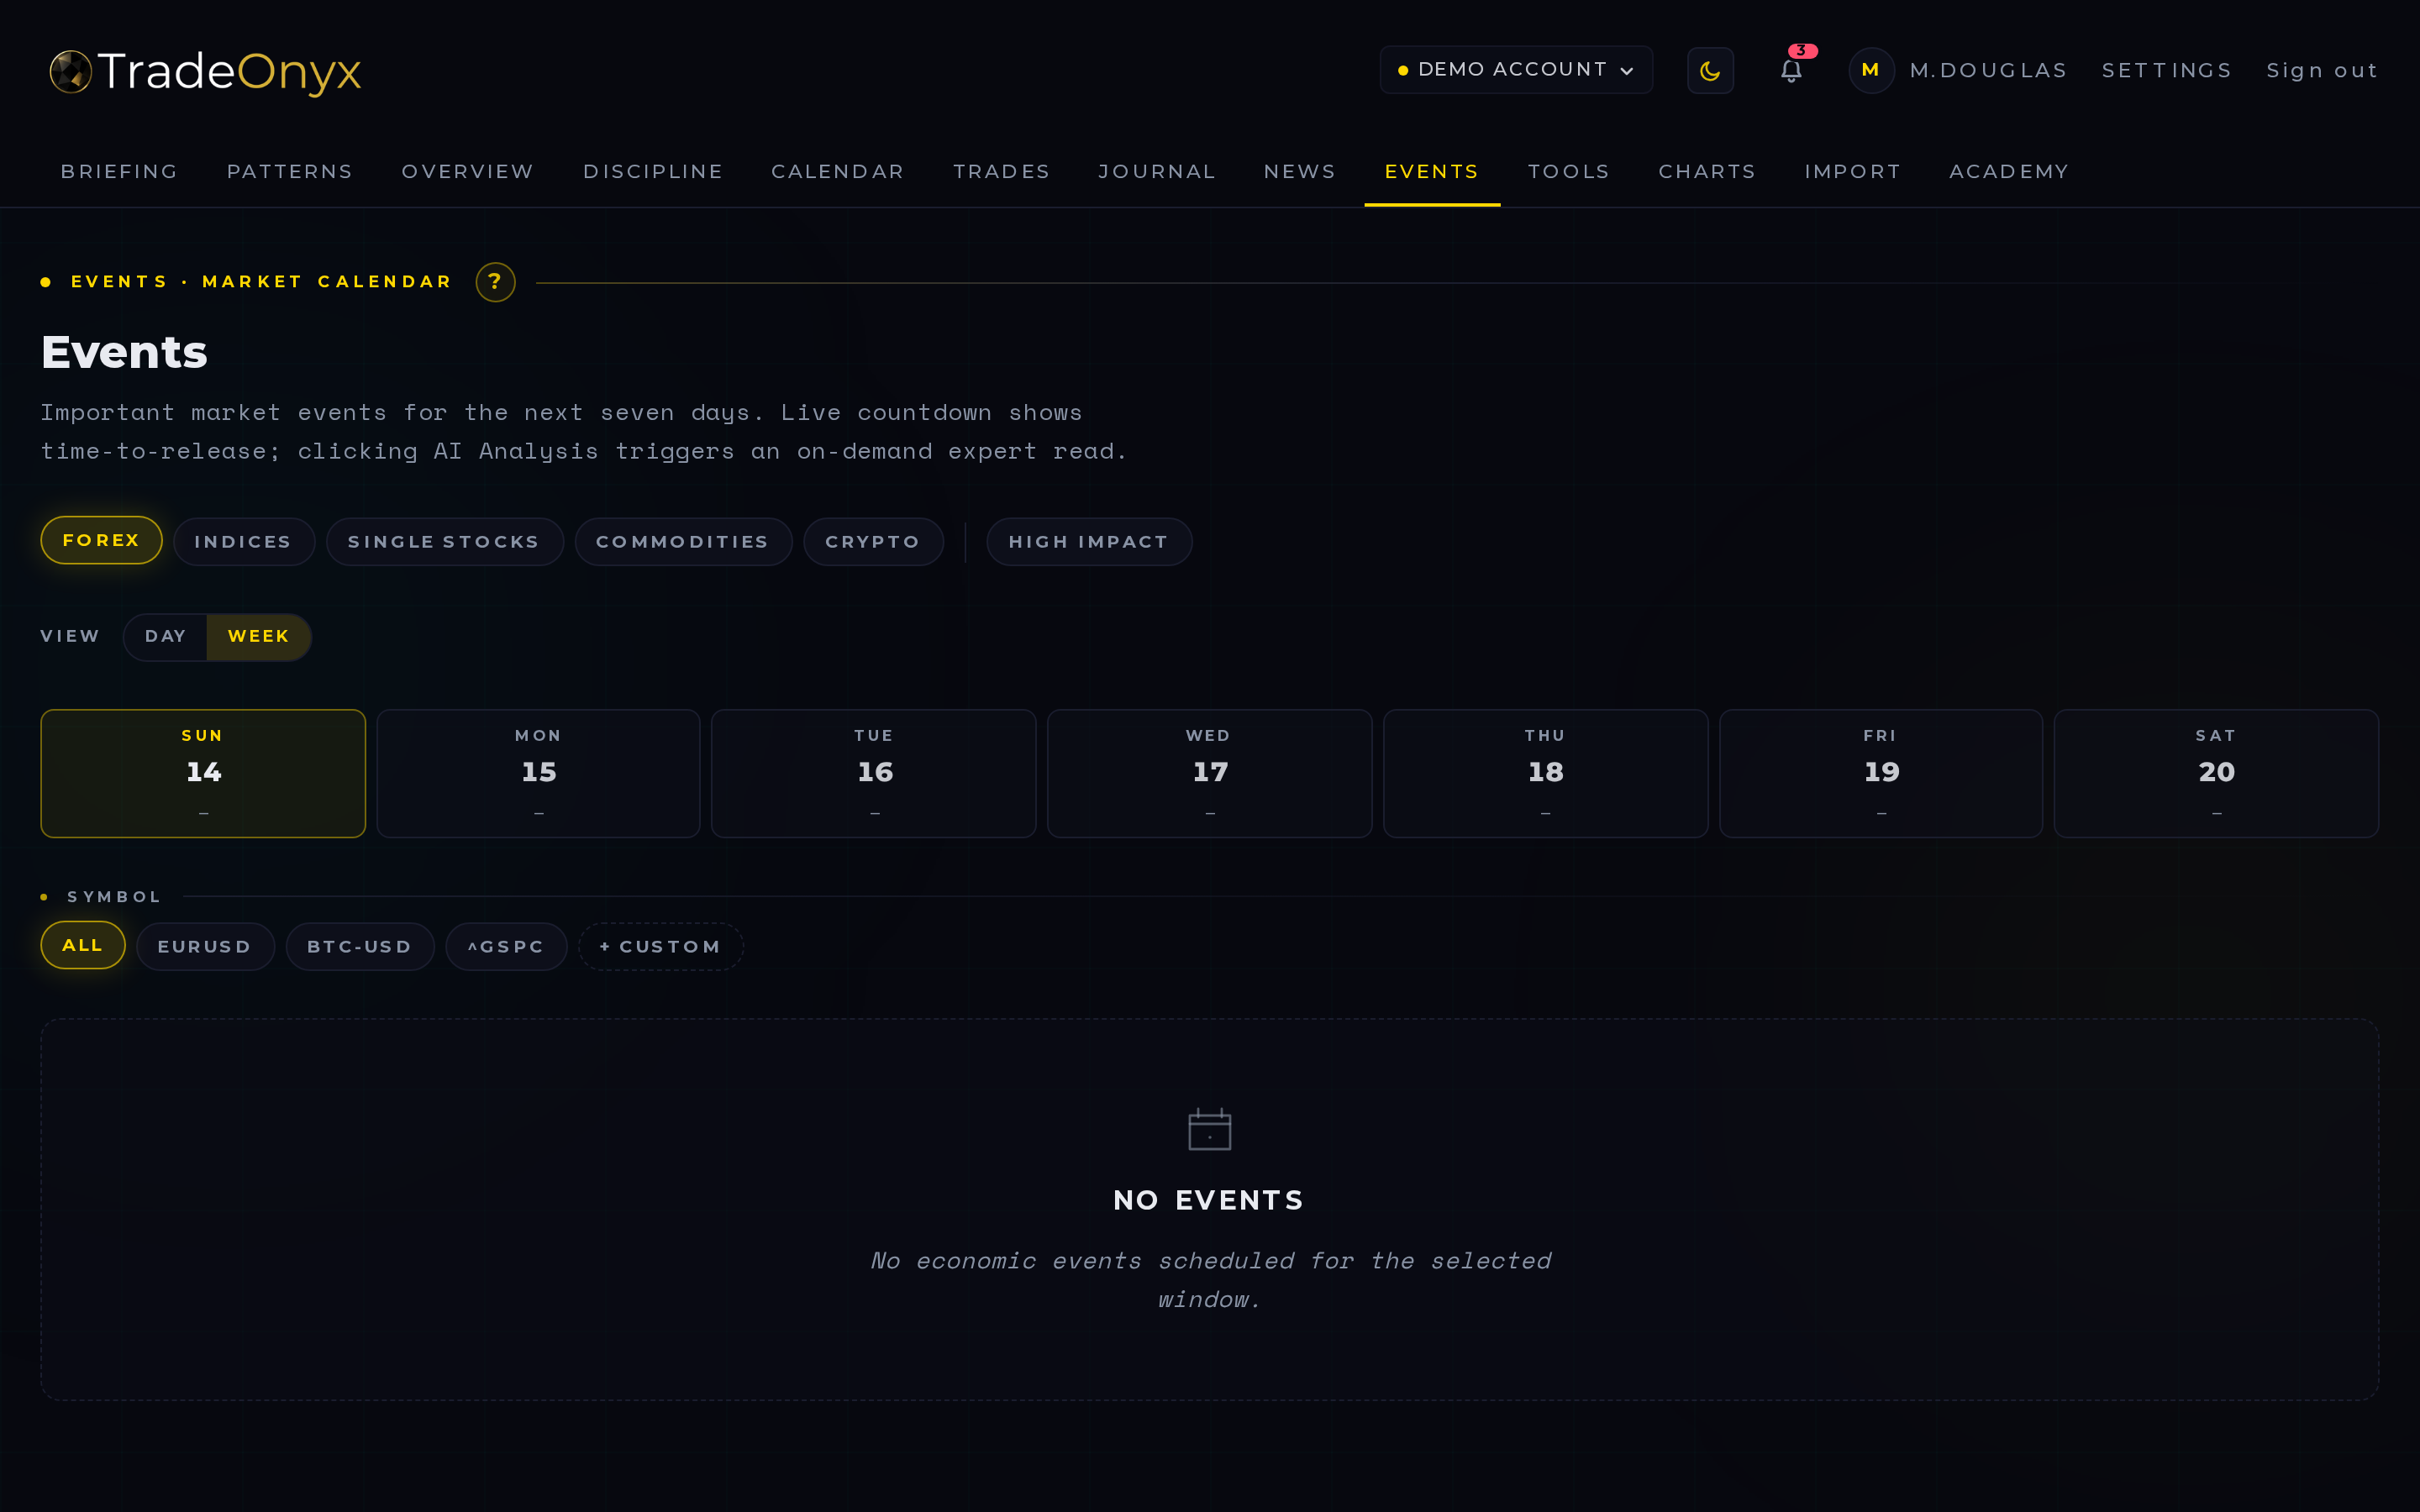
A 7-day heat-strip sits at the top — each cell shows the day's event count plus a red dot when any high-impact print falls on it. Today is highlighted in gold so your eye lands on what matters now. The Day / Week toggle next to the asset-class row collapses the list to a single focused day (perfect for the morning of) or opens the full week back up (perfect for the evening before). Clicking a day in the heat-strip jumps straight into Day view on that date.
A country filter narrows the list down to what touches your book. Trade DAX? Filter to Germany and the US. Trade USDJPY? Pull Japan and the US. The grid stays readable instead of drowning you in Bulgarian retail sales prints.
Your asset-class setting drives the default surface — forex traders see central-bank decisions and CPI prints front and center; index traders see PMIs and employment data. AI-generated per-event analysis is available on demand.
- Red impact flags are the planning anchors — schedule your day around them, don't be surprised by them.
- Forecast vs. Actual is the move trigger — the surprise relative to consensus moves price, not the headline number.
- Previous gives you the trajectory — three rising CPI prints in a row sets a different tone than a single hot one.
- Country filter keeps the noise out — most events on most days don't matter for your symbol.
- Cluster days are stand-aside days — three high-impact events in three hours means the tape will be unreadable.
- Use it the night before, not the morning of — your plan is better when the events are already plotted.
Open Economy the night before your trading day. Filter to your country list, scan for red flags, and TradeOnyx will surface those exact events back in tomorrow's Briefing — that's the link between the two tabs. Briefing pre-digests, Economy is the source of truth.
During the session, jump back to Economy twenty minutes before a print and check Forecast and Previous. If the market is positioned for a hot number and the Previous is already cold, you have a setup. The platform makes that comparison a single screen instead of three browser tabs.
For review, pair losing days from the Calendar with the events that printed that day. TradeOnyx often shows that your worst sessions cluster around events you traded through despite a red flag — the kind of pattern only this product surfaces, because it ties your real trades to the macro calendar in one workspace. The asset-class filter from Settings keeps the surface relevant to how you actually trade.