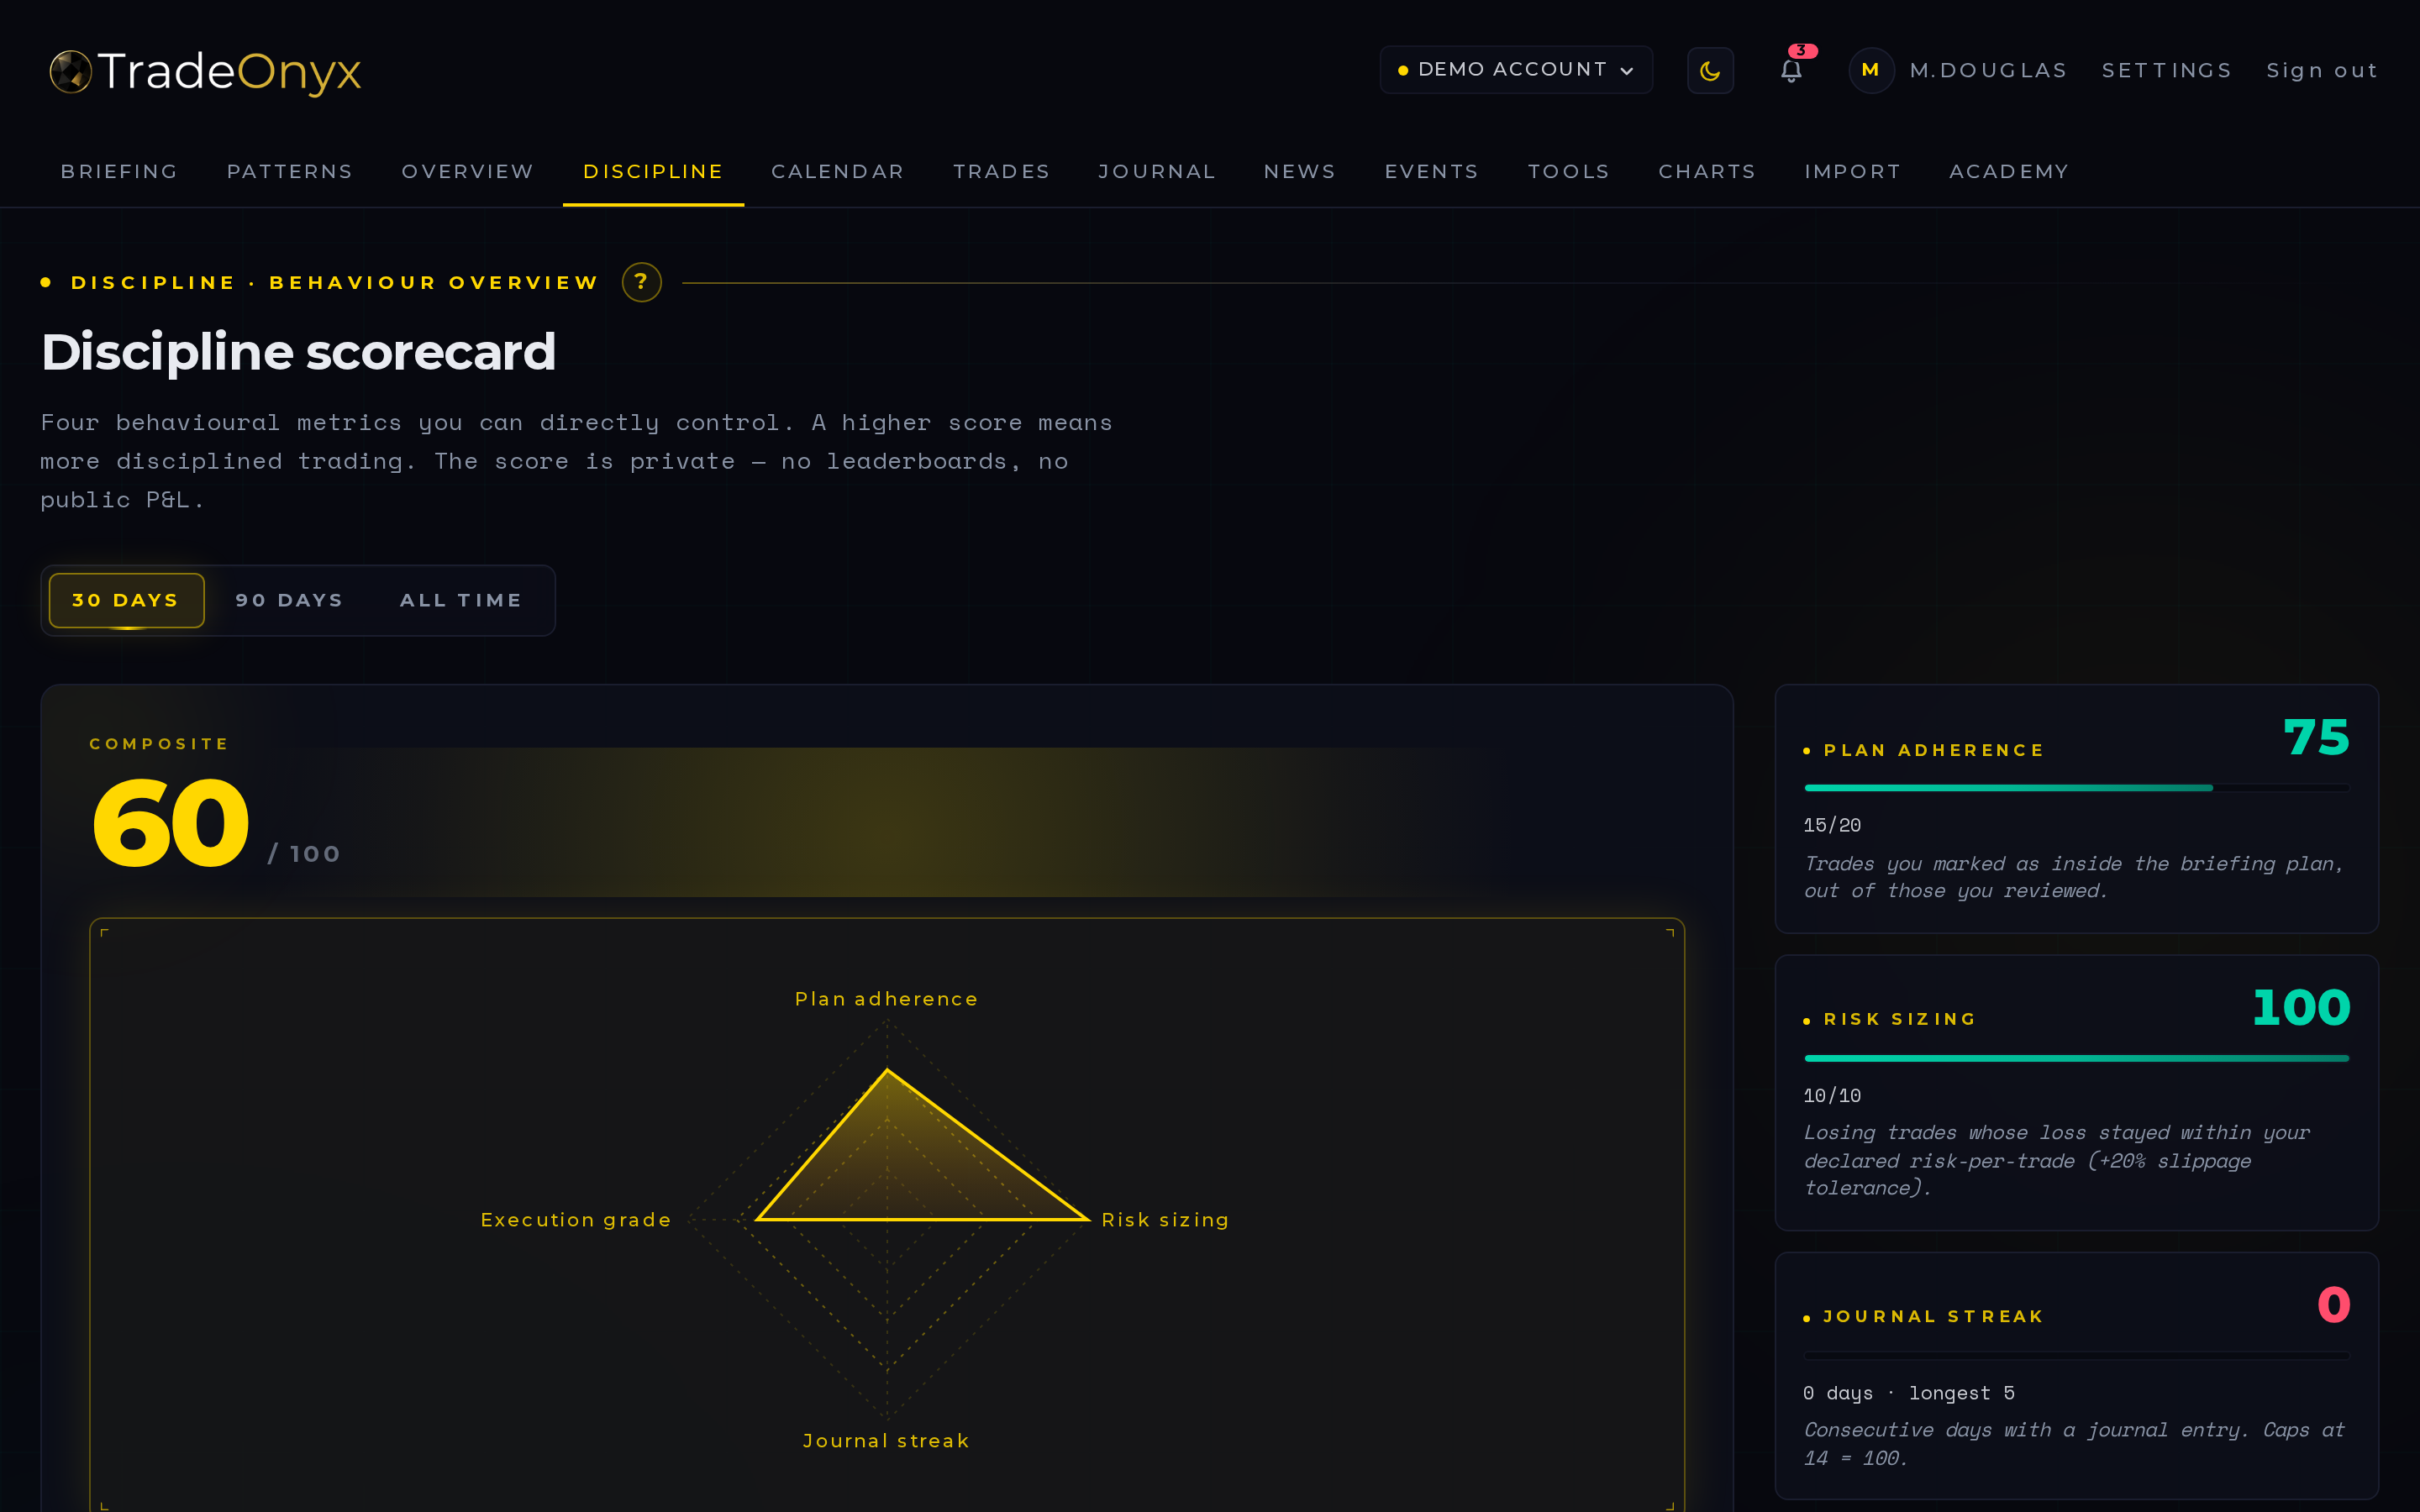
The Discipline Scorecard measures how you trade, not what you earn. Four axes, each scaled 0-100, each tied to a behaviour the trader controls:
- Plan-Adherence — % of trade reviews you marked as inside the briefing plan. Pre-trade discipline.
- Risk-Sizing — for losing trades only: % whose loss stayed within your declared risk-per-trade (+20% slippage tolerance). Sizing discipline.
- Journal-Streak — consecutive days with a journal entry, capped at 14 days = 100. Process discipline.
- Execution-Grade — % of trade reviews graded A or B, out of those you graded. Self-rated execution quality.
The composite is the simple average. Equal weight is the most defensible default until we have data on which axis correlates strongest with long-term P&L stability.
Rough zones to read each axis: - Below 50 — pattern, not noise. Whatever this axis measures isn't being respected often enough. Look at the count beneath the score. - 50-75 — workable but inconsistent. Look for the situations where the axis breaks (revenge-trading days, news spikes, fatigue). - 75-90 — disciplined. The axis is part of your routine, not effort. - Above 90 — exceptional. Worth checking the sample size — 5 plan-adherent trades isn't 50. - Composite < 50 — the trading isn't the bottleneck. The plan / sizing / process is. Fix one axis before chasing edges.
The Discipline Scorecard is what you check after a stretched losing week — not because the losses are the problem, but because the losses force the question "did I keep my discipline?" If the composite is 80 and the equity curve is down, the strategy needs a re-think. If the composite is 40 and the equity curve is down, the trader needs to fix themselves first.
In TradeOnyx the scorecard recomputes on every closed trade with a review. The period filter (30d / 90d / all) lets you compare regimes — a stable trader sees roughly the same composite across all three windows; a streak-trader sees a 30d spike and a 90d collapse.
The scorecard is explicitly not a leaderboard. There's no public P&L, no Top-10 ranking, no comparison with strangers. Trading platforms reward volume because that's what makes them money; a trading-journal platform should reward survival because that's what its users actually want.