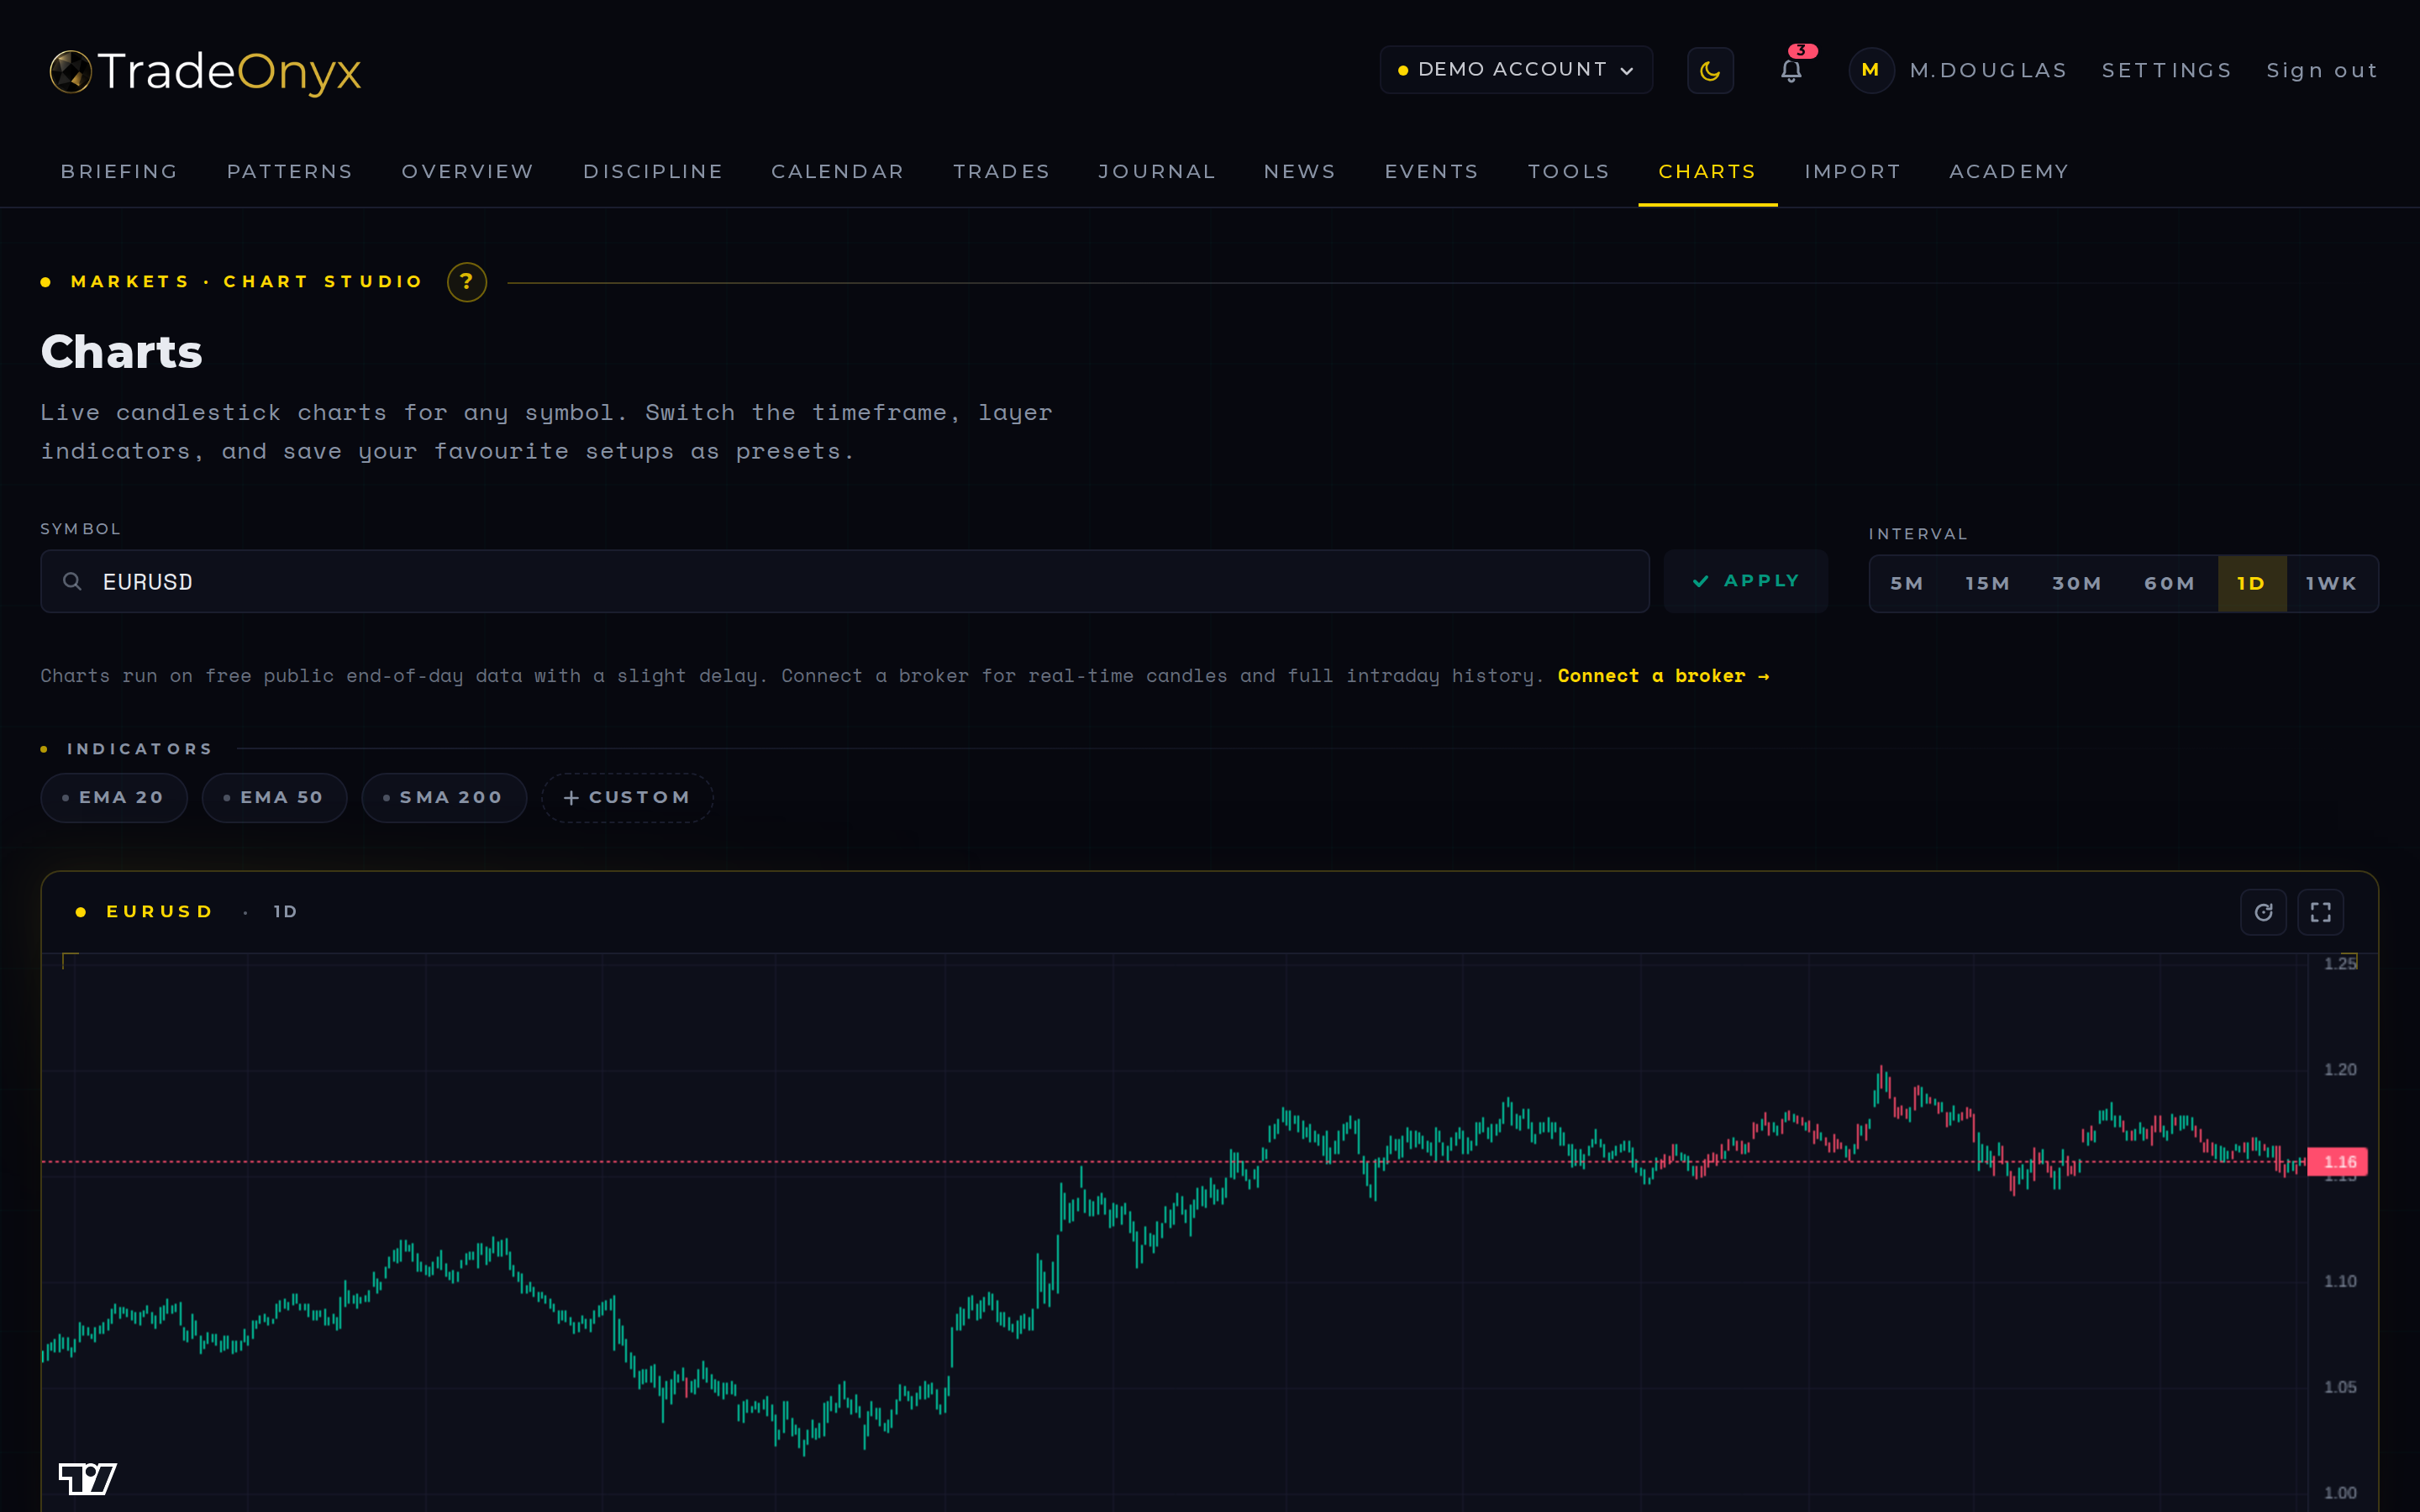
The Charts tab is a clean candle chart inside TradeOnyx. You pick a symbol, you pick a timeframe (1m, 5m, 15m, 30m, 1h, 4h, 1D, 1W), and you get a fast, readable chart with your EMAs.
The defining feature is the broker overlay: your actual entries and exits from the journal are plotted directly on the candles. The trade is no longer an abstract row in a table — it sits on the candle where it was filled.
Your zoom and viewport are saved per-symbol, so when you come back to EURUSD next week the chart opens exactly where you left it. Data comes from Yahoo Finance (delayed, free); for a live, higher-quality feed, connect a broker under Settings → Brokers.
- Multiple timeframes, one symbol — toggle between 5m and 1h to see whether your scalp aligned with the higher-timeframe trend.
- The overlay is truth — if your entry sits 10 pips above the level you said you were waiting for, the chart shows it cold.
- Compare symbols fast — switch from DAX to ES to gauge correlation before you size up.
- Review-friendly — pull up the chart for a closed trade and see exactly which candle you got wrong.
- Your view persists — zoom and timeframe are saved per-symbol, so each chart opens as a workspace, not a blank slate.
- Context where you journal — review the trade without flipping to a separate charting tab and losing your notes and stats.
Pre-trade: open Charts, eyeball the level you're watching on the higher timeframe, and switch back to the Briefing tab to confirm the day has no high-impact event that wrecks your plan.
Post-trade — the core use: from the Trades tab, open the symbol you just closed in Charts. The broker overlay drops your entry and exit onto the candles instantly — you see whether you front-ran the level or chased the breakout. Pair it with the note you wrote in Journal and the loop closes: thesis, execution, and outcome on one screen.
For multi-symbol days, Charts becomes the central comparison surface. Flip from EURUSD to GBPUSD to DXY in three clicks and check correlation before sizing up the next setup. Zoom and timeframe persist per-symbol, so each chart loads as a workspace, not a blank canvas.